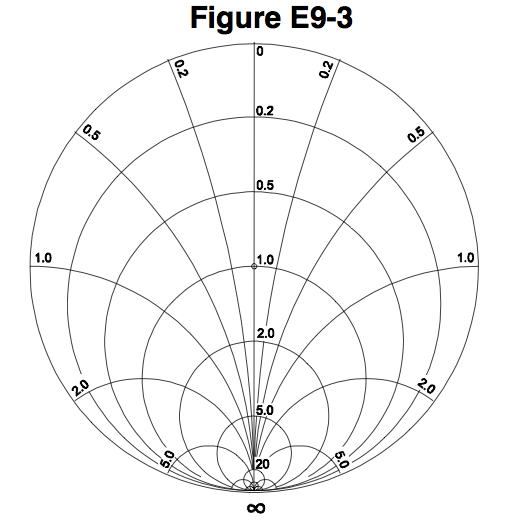
The Smith chart, invented by Phillip H. Smith (1905-1987),[1][2] is a graphical aid or nomogram designed for electrical and electronics engineers specializing in radio frequency (RF) engineering to assist in solving problems with transmission lines and matching circuits.
Last edited by verticalham. Register to edit
Tags: none
Smith charts have to do with Impedance matching (Resistance). The coordinate system used is resistance circles, and curves.
See: https://en.wikipedia.org/wiki/Smith_chart
Last edited by traveller_nl. Register to edit
Tags: none
A Smith chart is a graphical chart which shows the impedance and SWR values of an antenna system across a range of frequencies. Because it shows both SWR and Impedance it makes it easier to know what to adjust while designing antenna systems.
To learn more just search the web -- it's a complex topic but there are lots of articles!
Transmission lines, and matching circuits have all to do about matching impedence (resistance).
Memory aids from other users:
Smith & Wesson Rules! TranSMITHion
Last edited by kd7bbc. Register to edit
Tags: none
remember: smith chart uses R & R, resistance and reactance. Also remember complex impedance is \(R + jX\) with R being resistance and X being reactance.
See wikipedia article for more information
Last edited by kv0a. Register to edit
Tags: none
Tags: none
The key word here is "REACTANCE".
Reactance arcs terminate at the "REACTANCE" axis!
Last edited by kd5isa. Register to edit
Tags: none
Tags: none
The Smith chart is plotted on the complex reflection coefficient plane in two dimensions and is scaled in normalised impedance (the most common), normalised admittance or both, using different colours to distinguish between them. These are often known as the Z, Y and YZ Smith charts respectively.[7] Normalised scaling allows the Smith chart to be used for problems involving any characteristic or system impedance which is represented by the center point of the chart. The most commonly used normalization impedance is 50 ohms. Once an answer is obtained through the graphical constructions described below, it is straightforward to convert between normalised impedance (or normalised admittance) and the corresponding unnormalized value by multiplying by the characteristic impedance (admittance). Reflection coefficients can be read directly from the chart as they are unit-less parameters. Wikipedia.org https://en.wikipedia.org/wiki/Smith_chart
Hint: Only answer not ending with "axis" - Nate
Hint 2: A smith chart is round like a normal pie. Prime and Impedance spell Pi - Goose
Last edited by cq.n8gmz. Register to edit
Tags: none
The circles already present on the Smith chart include those for the resistive and reactive components of the normalized load impedance. One would normally use the intersection of these circles to identify the magnitude and angle of \(\Gamma\), the voltage reflection coefficient.
By maintaining a \(\Gamma\) of constant magnitude about the origin, one can draw a third group of circles. Because standing wave ratio only depends on this magnitude, these circles define the standing wave ratio.
Thus, the correct answer is standing-wave ratio circles.
Last edited by ironcal67. Register to edit
Tags: none
Tags: none
Tags: none